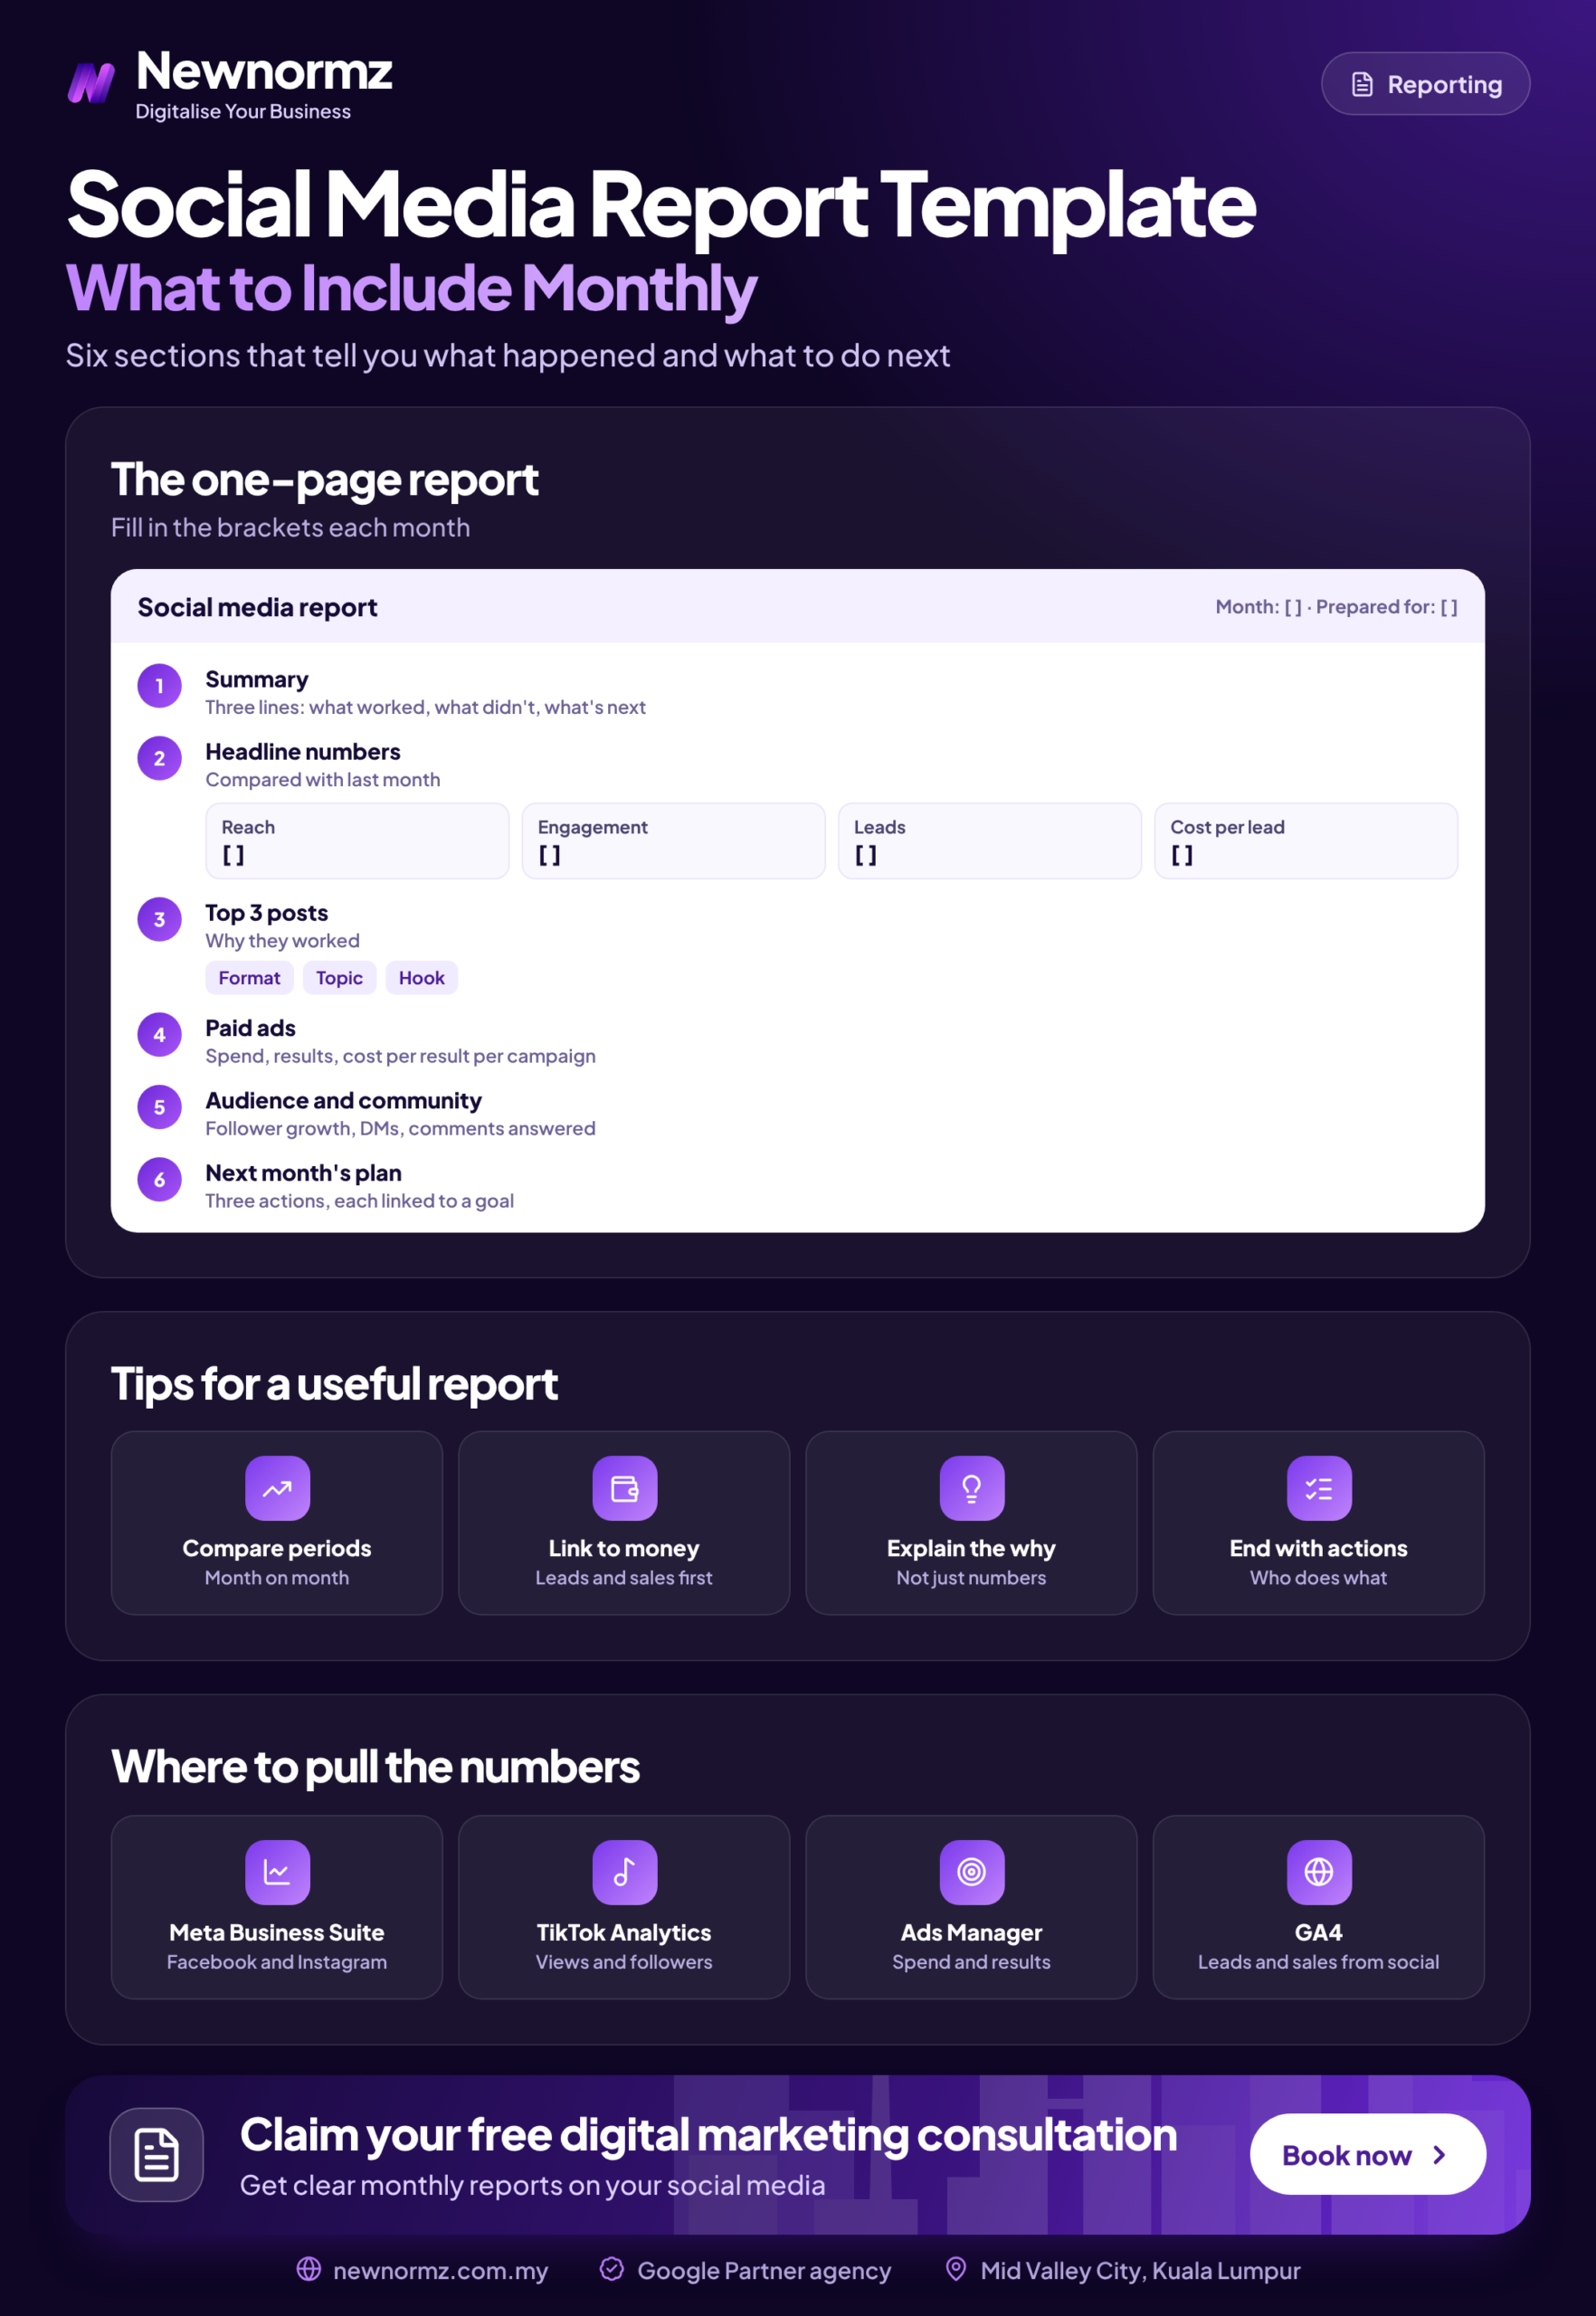
A good social media report template fits on one page plus an appendix, and it has 8 sections in this order: (1) a one-paragraph summary, (2) business outcomes: enquiries, qualified leads, customers and revenue, (3) paid performance by platform, (4) organic content performance, (5) enquiry handling across WhatsApp and DMs, (6) what you tested and learned, (7) problems and risks, and (8) next month’s plan and budget. Business results go first. Reach, likes and follower counts go in the appendix.
A report that doesn’t change what you do next month isn’t a report. It’s a scrapbook.
The Monthly Social Media Report Template, Section by Section
Copy this table into a doc or slide and use it as your social media monthly report template. Each row is one section of the report, in the order your boss or client should read it.
| Section | What goes in it | Where the data comes from | Who reads it |
|---|---|---|---|
| 1. Summary | One paragraph: what happened, why, and the one decision needed | Written last, from sections 2 to 8 | Director, owner, client |
| 2. Business outcomes | Enquiries, qualified leads, customers, revenue, cost per qualified lead | CRM or WhatsApp Business labels, GA4 conversions | Director, sales lead |
| 3. Paid performance by platform | Spend, results, cost per result, CTR, frequency per campaign | Meta Ads Manager, TikTok Ads Manager | Marketing manager |
| 4. Organic content | Top and bottom 3 posts, saves, shares, profile visits, link clicks | Meta Business Suite, TikTok and Xiaohongshu analytics | Marketing and content team |
| 5. Enquiry handling | First-reply time, unanswered chats, chats that became quotes | WhatsApp Business labels, Meta inbox, CRM | Sales or customer service lead |
| 6. Tests and learnings | What was tested, the result, and what you keep or kill | Ads Manager breakdowns, test log | Marketing manager, agency |
| 7. Problems and risks | Tracking gaps, rejected ads, creative fatigue, staffing issues | Account notifications, team notes | Director, marketing manager |
| 8. Next month’s plan | Budget split by platform, tests to run, content themes, dates | Sections 2 to 7, festive calendar | Everyone who signs off budget |
Keep the layout identical every month. A monthly social media report is most useful as a series: when the same rows sit in the same place, a falling qualified-lead rate or a rising reply time shows up in seconds instead of hiding in a new chart.
Why Your Report Should Open With Enquiries, Not Reach
At Newnormz, we work to one line: “Turn Attention into Enquiries. Not Just Views.” Social media gets judged on the enquiries and leads it brings in, so that’s what the first page of the report shows. Everything else explains how those enquiries happened, or why they didn’t.
The “200,000 Views, Three Enquiries” Meeting
Most marketers have sat through this meeting. The agency slide says 200,000 views and a strong engagement rate. The director asks how many customers came from it. Nobody in the room knows, and the answer turns out to be three enquiries.
Reach and engagement tell you how widely your content was distributed. They don’t measure demand. Engagement rate is the share of people who saw a post and then liked, commented, shared or saved it. It’s useful for comparing posts against each other, so put it in the organic diagnostics section, not the summary. When you list the social media metrics to track, put each one where it helps someone make a decision.
Where Vanity Metrics Go Instead
Follower count, likes and impressions go to the appendix, each with one line explaining why it changed (“followers up 400 after the Deepavali giveaway, mostly non-buyers”). That way they’re on record without taking up page one.
A few leading indicators do belong in the body of a social media KPI report, because they tell you early whether results are about to rise or fall:
- Hook rate: the share of viewers who watched the first 3 seconds of a video. A low hook rate means the opening isn’t stopping the scroll.
- CTR (click-through rate): the share of people who saw an ad and clicked it.
- Frequency: the average number of times each person saw the ad. Rising frequency with a falling CTR is creative fatigue: the same people have seen the ad too often and have stopped responding.
- Saves and shares: better signals of genuine interest than likes, because they take more effort.
For help deciding which of these belong in your business’s version, see our guide to choosing the right social media KPIs.
Attribution Has to Be Set Up Before the Report Can Be Honest
The outcomes section is only as good as the tracking behind it. Before you trust it, check these five things:
Attribution setup checklist
- ✓Meta Pixel plus Conversions API (CAPI, which sends conversions from your server so browser blocking loses fewer of them)
- ✓TikTok Pixel or Events API, sending the same events you track on Meta
- ✓UTM parameters on every bio link, Linktree button and ad URL
- ✓GA4 conversions set up for forms, WhatsApp button clicks and purchases
- ✓WhatsApp Business labels to tag where each chat came from (“FB ad”, “TikTok”, “IG bio”) and its stage (“quoted”, “won”)
Without these, the outcomes section is guesswork, however tidy the charts look.
From our audits
One pattern we keep finding: the metrics in a report change every month. Leads appear in a good month, then get swapped for “engagement” in a bad one, so the weak month never shows up on any chart. The fix is to lock the metric list for a full quarter. If a metric needs changing, change it at the start of the next quarter and note the change in writing.
A Filled-In Social Media Report Example: One Month for a Malaysian SME
The numbers below are a hypothetical example, not market rates. They show how the outcomes section should read for a service business running two Meta campaigns with RM2,500 spend each. This is the part of a Facebook ads report that most templates skip.
| Metric (example numbers) | Campaign A: Instant Form | Campaign B: Click-to-WhatsApp |
|---|---|---|
| Spend | RM2,500 | RM2,500 |
| Leads or conversations | 100 leads | 50 conversations |
| Cost per lead | RM25 | RM50 |
| Qualified leads | 15 | 20 |
| Cost per qualified lead | RM166.67 | RM125 |
| Customers | 3 | 6 |
| Cost per customer | RM833 | RM417 |
Cost per qualified lead is your ad spend divided by the number of leads that meet your sales team’s bar: right budget, right location, a real need, and still reachable. If your report stopped at cost per lead, Campaign A would look twice as efficient and would get next month’s budget. When you carry the numbers through to qualified leads and customers, the result reverses: Campaign B wins customers at half the cost. Instant Forms make it easy to submit with one tap, which brings in volume but also casual submissions. A WhatsApp chat takes more effort, so more of the people who start one actually want to buy.
That’s why the minimum line for any social media ROI conversation is qualified leads. If you know your average order value, add revenue and plug it into our free social media ROAS calculator to see what return each campaign is producing.
Newnormz take
Add a lead-to-appointment row too. On a Google Ads campaign we ran for a chiropractic centre in PJ (paid search, not social), 60 to 70% of leads became appointments. Having that conversion rate on record is what lets a report connect ad spend to real visits, and social campaigns need the same row.
The Malaysia Lines Most Report Templates Leave Out
Most downloadable templates are written for US or UK accounts. In Malaysia, three extra lines often explain more about the result than anything inside Ads Manager.
WhatsApp Response Time and Who Answered the Chat
In our experience, most Malaysian enquiries end up in WhatsApp, whichever platform started them. Report three numbers each month: median first-reply time, chats left unanswered, and conversations that became quotes. Also note who handled the chats. A cheap lead answered six hours later is often a lost lead, and no amount of ad optimisation will show you that. Our guide to handling enquiries in comments and DMs covers how to set up reply rules that keep these numbers healthy.
Results Split by Language: English, BM and Chinese
Report creative performance and cost per qualified lead for each language segment, not as one blended figure. A blended average lets a strong English ad hide a weak Bahasa Malaysia ad, and the BM audience keeps seeing it. If you target Chinese-Malaysian lifestyle or beauty audiences, give Xiaohongshu its own line with its own enquiry count, because its audience and content style differ from Instagram’s.
Festive and Sale-Month Context
Ramadan and Hari Raya, Chinese New Year, Deepavali and the 9.9, 10.10, 11.11 and 12.12 sales all bring more advertisers into the auction, so competition and costs usually rise. Comparing November with October will mislead your director. Add a year-on-year column next to month-on-month, plus a one-line context note (“11.11 week, competitor promos heavy”). With that column and note in place, a social media performance report can tell a real decline apart from normal seasonal noise.
What Changes the Report: Which Headline Metric Fits Your Business
The 8 sections stay the same, but the number in the summary depends on how you sell. Use these rules when you set up a social media report for clients or for your own boss, and keep them consistent with your quarterly social media strategy.
How to Build Your Monthly Social Media Report in About 90 Minutes
Once tracking is in place, social media reporting becomes a routine you can repeat every month. Here is the order to work in:
Export one date range from every platform
Pull the same calendar month from Meta Ads Manager, TikTok Ads Manager and Meta Business Suite. Mismatched dates cause most reports that don’t add up. If you need help choosing a dashboard, compare these social media analytics tools worth paying for.
Pull GA4 conversions by UTM source
Use GA4’s traffic acquisition report filtered by source and medium, so form fills and WhatsApp clicks are credited to the right platform. Looker Studio can automate steps 1 and 2 with a template that refreshes itself.
Count qualified leads and customers
Use the CRM or your WhatsApp Business labels. Ask sales to confirm the numbers. Ads Manager can’t tell you who actually bought.
Fill in outcomes first, platforms second
Complete section 2 before you touch the platform sections, so the business result frames everything that follows.
Write three insights, each with an action
Every insight ends with “so next month we will…”. An insight with no action attached is just a description of what happened.
Log tests and set next month’s budget split
Record what you tested, what won, and the planned spend per platform and campaign. That makes this a social media analytics report someone can approve, not just read.
If building this takes a full day every month, or the attribution setup in this guide isn’t in place yet, it may be time to hand it to a specialist team. Our social media marketing services include analytics and reporting, and our process ends with performance tracking and optimisation, so the report feeds straight into next month’s decisions.
FAQ
What should be included in a monthly social media report?
A monthly social media report should include a summary, business outcomes, paid performance by platform, organic content, enquiry handling, tests and learnings, problems and risks, and next month’s plan. Put outcomes such as qualified leads and revenue before any platform metric, and move reach and likes to an appendix.
How long should a monthly social media report be?
One page of findings plus an appendix is enough for most businesses. Your director should be able to read the summary and outcomes in two minutes. Detailed platform tables can sit in the appendix for anyone who wants them.
What is the difference between a social media report and a social media audit?
A report tracks one month’s performance against your goals, while an audit reviews your whole setup: accounts, tracking, content, targeting and processes. Most brands report monthly and audit once or twice a year, or when results drop for no clear reason. Our step-by-step guide to a full social media audit explains what that review covers.
How do you track WhatsApp enquiries from social media in a report?
Tag every chat with a WhatsApp Business label for its source and stage, and add UTM parameters to any WhatsApp link on your website. Click-to-WhatsApp ads also show conversations started in Ads Manager, but only your labels or CRM can show which chats became quotes and sales.
Should you compare social media results month on month or year on year?
Use both, side by side. Month on month shows short-term direction. Year on year removes festive and sale-season distortion, which matters in Malaysia around Raya, CNY, Deepavali and the 11.11 and 12.12 sales.
Does your social media report show enquiries, or just views?
Newnormz plans, creates and runs social media and paid social for Malaysian brands, and judges every campaign on enquiries, not just views. 5.0 rating from 214+ Google reviews. Send us a WhatsApp message and a strategist will reply within business hours.
Prefer a form? Free social media audit

Bryan Tan is an SEO Specialist and CEO at Newnormz, helping hundreds of businesses achieve first-page rankings on Google. With a passion for driving organic growth, Bryan blends innovative strategies with hands-on experience to optimize websites for maximum visibility. Always at the forefront of the latest SEO insights and trends, he consistently adapts to the evolving digital landscape.